In August 2014, crude oil prices began their continuous and steep slide, pulling down prices of petroleum products such as benzene or propylene.
In 2014, the global economy continued the slow pace of its recovery from recession, and demand for chemicals in sectors which typically sensitive to GDP growth, such as construction, automotive industry, household appliances and electronics, remained subdued. Prices of goods along the supply chain showed slow growth, following weak demand and good availability of products on the market.
In August 2014, crude oil prices began their continuous and steep slide, pulling down prices of petroleum products such as benzene or propylene. Consequently, the prices further along the supply chain started to decline, with the decrease finally manifesting itself in prices of the Group’s final products, such plastics and oxo chemicals.
Even though in the context of poor performance of EU economies Poland maintained a relatively good pace of GDP growth, certain indicators deteriorated, including export growth, which was however compensated by domestic sales.
Agro Fertilizers
Economic conditions in agriculture
Exceptionally good weather conditions resulted in another season of high grain yields, contributing to higher grain stocks around the globe, in Europe and in Poland. That, combined with a strong dollar which limited exports to the US and caused prices to slump in the US market, contributed to a decline in prices of agricultural produce.
In Poland, this was mitigated by exports and the system of direct subsidies, which in are distributed by the Agency for Restructuring and Modernisation of Agriculture (subsidy payments by the Agency began in December 2014). The 2014 subsidies, which are to be distributed to 1,350 thousand Polish farmers, totalled PLN 14.2bn (2013: PLN 14.91bn). Apart from the direct subsidies, there are other sources of subsidising the sector available under a number agriculture support programmes operated as part of the EU Common Agricultural Policy.
Oil seed rape, wheat, rye and corn prices

Fertilizer market
CAN, AN and AS prices

Ammonium nitrate/calcium ammonium nitrate (CAN)
In 2014, the average annual CAN prices increased marginally relative to 2013, whereas a slight decrease was seen in ammonium nitrate prices. The average annual price of CAN was up from EUR 242/tonne in 2013 to EUR 247/tonne in 2014, while ammonium nitrate prices fell from EUR 319/tonne in 2013 to EUR 314/tonne a year later.
Ammonium sulfate
Prices of ammonium sulfate went down year on year in 2014; the average annual price decreased from USD 161/t in 2013 to USD 133/t in 2014. In 2014, the ammonium sulfate market continued to see oversupply driven chiefly by the increase in Chinese production capacities.
Ammonia and urea prices

Ammonia
In 2014, both supply and demand on the ammonia market remained low. The greater demand for ammonia first in the spring and then in late October and early November 2014 was supported mainly by the US market, but it was not strong enough to weather unexpected snowfalls. It is estimated that US farmers applied only ca. 50% of the usual volume.
2014 saw significant and rapid changes in ammonia prices, but ultimately the average annual ammonia price (FOB) rose year on year, from USD 477/tonne in 2013 to USD 493/tonne.
The ammonia market in 2014 was chiefly affected by factory shut-downs and reduced output in Egypt, Trinidad, Russia, Algeria, Indonesia, Australia, Libya, Turkey, Saudi Arabia, Ukraine and Latvia, which were mainly caused by unit failures and reduced gas supply. The military conflict in Ukraine also had an impact on the market conditions, as the Yuzhny terminal (Black Sea, Ukraine) is an important world ammonia trade hub.
Urea
In 2014, the global urea market was tight in terms of supply and demand. Production cuts (due to overhaul shut-downs), political situation (e.g. the Ukraine crisis) and a temporary surge in demand for urea in India had an impact on the prices. Eventually the prices slid on continued slowdown in this market segment in 2014 (attributable to, among other things, weaker demand for urea in the US in Q1 2014), and speculative behaviour of market players withholding their urea purchases in anticipation of price decline. Prices of urea went down year on year in 2014; the average annual price decreased from USD 329/tonne in 2013 to USD 314/tonne in 2014.
UAN
The average UAN price was EUR 185/t in 2014, down approximately 5% on 2013. UAN prices were on a downward trend practically throughout the year, and the price per unit of nitrogen contained in the fertilizer continued as one of the most attractive to buyers among all the nitrogen fertilizers. Other important developments included increasing interest in the European markets among US and Russian producers, but also higher UAN exports from China (mainly to the USA, Australia and South America).
Prices of NPK, DAP, potassium chloride and phosphate rock

NPK fertilizers
In the domestic NPK market, the beginning of 2014 was marked by limited demand as farmers held considerable fertilizer stocks and the weather conditions were unfavourable. A slight improvement in demand was seen as time came for spring farming. In the second half of August and the first half of September, there was a significant seasonal increase in the volume of NPK fertilizers purchased in connection with the anticipated autumn fertilizer applications. Given low prices of agricultural produce and lower farming incomes, farmers were forced to look for savings, so they opted for cheaper imported substitutes or lower concentration fertilizers from other Polish manufacturers (Luvena, Siarkopol, Fosfan), which are cheaper per tonne of fertilizer although have a lower content of pure nutritional elements.
After the autumn season, low prices of agricultural crops kept farmers from purchasing NPK fertilizers. The leading NPK fertilizer manufacturers in Western Europe maintained the prices of their standard products. The only and minor price reductions were seen in October, and were intended to encourage customers to buy and store fertilizers.
DAP fertilizers
Prices of DAP fertilizers remained high throughout 2014. Compared with the previous year, prices rose, from the average annual level of USD 456/t in 2013 to USD 476/t (FOB Baltic). The growing trend in demand for DAP, which set in late in 2013, continued into the first quarter of 2014. In the following quarter, many manufacturers reduced their output due to feedstock-related factors, for technical reasons or due to adverse weather conditions, as a result of which prices fell. Trends in DAP demand and prices varied on the global markets, depending on the region. Continuing strong demand in the Asian markets (India, Pakistan, Bangladesh, Vietnam) and in the internal market in China, was driving DAP prices up in those markets. Chinese manufacturers implemented the government programme to build up stocks of DAP for autumn. In South America, in the US and in Europe demand for DAP remained feeble mainly on the back of decreasing agricultural produce prices in the global markets. In Brazil, low prices of crops (soya, corn) and severe drought resulted in a dramatic decline of purchases of phosphate fertilizers, including DAP. Limited DAP supply in the fourth quarter of the year and the slight increase in prices of agricultural produce stabilised the DAP prices on the global markets and set them on a slow upward trend.
Potassium chloride (KCl)
Prices of potassium chloride went sharply down year on year in 2014; the average annual price decreased from USD 370/tonne in 2013 to USD 292/tonne in 2014 (FOB Baltic spot).
At the beginning of 2014, large contracts for supplies of potassium chloride to China were negotiated, and the prices agreed under those contracts marked a benchmark for customers from markets such as India, Malaysia, the Philippines, Indonesia or Brazil. Low prices of agricultural produce caused demand for potassium chloride in the European markets to remain flat.
The potassium chloride market continues to be oversupplied. The estimated global excess of KCl production capacity over demand for the product is currently about 8m tonnes, and even suspension of KCl extraction by Uralkali in November hardly changed the situation (the capacity excess contracted by 2m tonnes).
Phosphate rock
Following the price modifications at the beginning of 2014, the global market for phosphate rock saw practically no major changes until the end of the year. The only exception were minor increases in prices of Moroccan phosphate rock in August, when OCP Morocco raised the price of its phosphate rock from USD 115-130/tonne to USD 120-130/tonne (FOB Morocco). In November there was a decrease in quoted prices of Togolese phosphate rock, which fell from USD 130-135/tonne to USD 120-125/tonne (FOB Togo).
Generally, prices of phosphate rock in 2014 were lower than a year earlier; the average annual price fell from USD 140/tonne in 2013 to USD 123/tonne in 2014 (FOB North Africa).
Plastics
Prices of caprolactam, PA6, benzene and phenol

Caprolactam
The caprolactam market depends heavily on demand for polyamide and on the cost of raw materials pegged to crude prices. Demand for caprolactam in Europe remained weak, albeit stable. In Europe and Asia the oversupply of caprolactam prevailed, resulting from the rapid growth of production in China. In 2014, the average annual price of liquid caprolactam (DDP WE) was EUR 1,900/tonne, compared with EUR 1,886/tonne in the previous year, while flaked caprolactam prices (CFR N.E.ASIA) stood at USD 2,255/tonne vs. USD 2,422/tonne a year ago.
Polyamide 6
The demand on the polyamide market remained stable throughout 2014. Construction of new production units in Asia starts to put the polyamide 6 market under significant stress, as it may lead to lower exports to the region, and even to imports of Asian-made polyamide 6 to Europe. In 2013, the average annual contract price of polyamide 6 was EUR 2,000/tonne (Engineering Resin, Virgin, DDP, Tecnon). In 2014, however, the price increased by ca. 1%, to EUR 2,021/tonne.
Benzene
Until August 2014, contract prices of benzene remained high, which was not directly reflected on the European market for caprolactam and polyamide. The trend followed from strong demand for benzene (exports outside the EU), structural imbalance of supply and demand across the Atlantic basin, significant increase in demand on global markets (driven by higher purchases of European benzene by the United States) as well as speculative transactions (fall from the high price levels seen in May 2014). The benzene market was also affected by EUR/USD exchange rate fluctuations and falling prices of crude oil, in particular in November and December 2014, which contributed to a significant decline in benzene prices.
Year on year, a slight drop in benzene prices was observed: the average price in 2014 (FOB NWE) was EUR 995/tonne, compared with EUR 998/tonne in the previous year. The drop in oil prices in August 2014 brought about, although with some delay, a significant decline in benzene prices. Moreover, benzene imports began to arrive from the Middle East, which improved the supply and demand balance on the benzene market in Europe. The Grupa Azoty Group has a diversified and secure portfolio of benzene suppliers.
Phenol
The market conditions were mainly affected by benzene prices. The average phenol capacity utilisation rate at Europe’s largest plants was relatively low. The conditions on the acetone market helped stabilise the phenol market Also, supplies from non-European countries (spot) increased.
Year on year, there was a slight decline in the average annual price of phenol, to EUR 1,576/tonne recorded in 2014, from EUR 1,582/tonne in 2013 (FD NWE).
Chemicals
2-EH, n-Butanol, DEHP, OT (DOTP) and propylene prices
 and propylene prices")
Propylene
Despite some downward movements seen in the second half of the year, there was a 2.13% increase in average propylene prices year on year, from EUR 1,057/tonne (FD NWE) in 2013 to EUR 1,079/tonne in 2014. The significant declines in propylene prices in the second half of the year did not fully offset the increases seen in early 2014.
In the opening months of 2014, overhauls and stoppages at a number of production facilities resulted in a shortage of propylene on the market. With cracker capacities coming back on stream, gradual improvement of the demand and supply situation could was seen from May onwards. Propylene availability also improved on the back of depressed demand in the summer months. Towards the end of the year, following a decline in propylene prices, demand increased and remained high almost until the end of 2014.
Oxo alcohols and plasticizers
In 2014, prices of OXO alcohols and plasticizers (USD, FD NWE) were lower than in the previous year, as presented in the table below:
| 2-EH | n-butanol | DOP | DOTP | |
|---|---|---|---|---|
| 2013 | 1,446 | 1,137 | 1,565 | 1,583 |
| 2014 | 1,390 | 1,122 | 1,512 | 1,517 |
| (3.92) % | (1.3) % | (3.33) % | (4.16) % |
Source: ICIS.
In 2014, the demand on Europe’s target markets for OXO alcohols remained broadly flat year on year. The situation on the plasticizer market was different. Last year saw demand for DEHP decline sharply in favour of its substitute, Oxoviflex (DOTP), which is becoming a key compound in the PCV industry.
The market for OXO alcohols and plasticizers was disrupted by imports from Russia, Turkey and Asia, while the export capacities of European countries were periodically limited by unfavourable foreign exchange rates.
Prices of OXO alcohols and plasticizers were negatively affected by declining prices of petrochemical feedstocks, which brought downward pressures in H2 2014.
Prices of melamine and hydrogen peroxide (100% solution)
")
Melamine
In 2014, contract prices of melamine on the European market decreased EUR 77/tonne (down 5.5%) year on year. Following an increase in prices in Q4 2014, the European melamine market stabilised in a similar fashion as in the holiday season.
In terms of supply and demand, the European market in 2014 was stable. Abundant quantities of the product were supplied to the market, both by European manufacturers and from import channels.
Hydrogen peroxide
In 2014, the European market of hydrogen peroxide also remained stable. Year on year, a slight drop in prices was observed: the average price in 2014 (FD Europe) was EUR 919/tonne, compared with EUR 920/tonne in the previous year.
In 2014, an increase in demand for hydrogen peroxide was recorded in the sector of paper pulp production and other applications (chemical, mining and environmental protection industries), in particular in Northern Europe. Utilisation of production capacities in Europe reached 90%.
Market prices of titanium white and ilmenite

Titanium white
In 2014, global titanium white prices remained at low but stable levels.
Titanium white prices decreased by ca. 4% year on year, with the average price in 2014 (FD NWE) down from EUR 2,442/tonne in 2013 to EUR 2,353/tonne in 2014.
One of the largest sources of demand − the paper industry − has been recording declining sales for many years. Lower demand was also recorded for another application, namely the coating sector, which generates 60% of total demand for TiO2. With the prevailing oversupply, there were no availability constraints on the titanium white market.
Ilmenite and titanium slag
Average ilmenite prices declined throughout 2014, from approximately EUR 207/tonne (Ex Works China) in 2013, to USD 113/tonne in 2014, falling to their lowest in December – at USD 90/tonne. The decline in the price of raw materials for production of titanium white was driven by low demand for products in titanium white application areas.
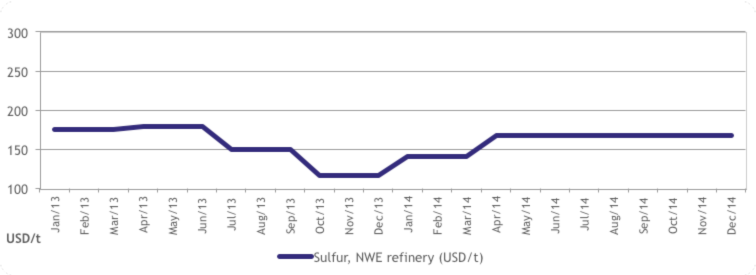
Sulfur prices
Source: FERTECON, Profercy
Sulfur
In 2014, the average annual sulfur price was USD 160/tonne, up 3.7% year on year from USD 155/tonne in 2013 (NWE Rafinery Fertecon). Since April, when sulfur prices surged from USD 140/tonne to USD 167/tonne, the trading price has remained virtually the same. The reason for the rise in sulfur prices in Europe in Q2 2014 was limited supply (due to overhaul shut-downs of petrochemical units). The stability of the sulfur market in Europe was not shared by the global markets, where the price consistently grew in Q1 2014, to reach USD 200/tonne (FOB Persian Gulf). Higher global prices stemmed from reduced sulfur production in the Persian Gulf region and China, logistics difficulties resulting from a harsh winter in Russia and Canada, and increased sulfur imports by India and China. At the end of Q1 2014, the price of sulfur on the global markets supplied from the Persian Gulf region dropped by USD 50/tonne, chiefly due to lower volumes purchased by China (shut-down of fertilizer units). On the global markets, in Q3 and Q4 2014 the sulfur prices consistently deceased mainly as a result of limited production in the phosphate fertilizer industry, which is the largest sulfur consumer. In the Persian Gulf region, due to overstocking the sulfur price fell in Q4 2014 to USD 120/tonne (FOB Persian Gulf).
In December, the demand in China picked up and the global sulfur price in dated transactions for delivery in January began to rise, reaching USD 150/tonne (FOB Persian Gulf), with a potential for further growth.
Energy Segment
Natural gas
The mild 2013/2014 winter, stable supplies, as well as the high level of stocks built for fear of the effect of the Russian-Ukrainian on gas availability in the European Union, resulted in saturation of the European market and consistent decline in gas prices at western gas hubs. Concurrently, in 2014 gas imports were much more economical than gas purchases from PGNiG at tariff price. The tariff price was slightly reduced at the beginning of the year and remained relatively unchanged until the year end despite a tariff change as in August 2014 due to a change in settlement rules, whereby gas is now settled based in energy units.
Until September, gas prices on the Polish Power Exchange were strongly correlated with gas prices at German hubs, and before August, when PGNiG established a retail trading company which purchases gas on the Polish Power Exchange, the liquidity of the market was low. From then on, gas trading on the Polish Power Exchange increased significantly, but the prices oscillated closer to the tariff price.
Electricity
With the average temperature of 10.06°C, 2014 was one of the warmest years on record. Demand for electricity in the National Power Grid grew 0.6% year on year, with concurrent drop in electricity generated from conventional sources by ca. 4%. Wind-generated electricity grew only 26% relative to 2013, which resulted from several months of no-wind conditions and a lower number of completed new wind projects. Wind turbines covered 4.6% of Poland’s demand for electricity in 2014.
The average price of electricity on the Day-Ahead Market of the Polish Power Exchange grew 14.4% year on year, driven by the rising CO2 prices, introduction of fees for operating reserves, and activities of the Transmission System Operator, involving a lack of possibility to import less expensive electricity or exchange energy between operators’ control areas. All these factors translated into higher electricity prices on the balancing market, where the average annual price grew 15.3% relative to the previous year.
On the forward market, contract prices for 2015 rose during 2014 by nearly PLN 20, while the average price of electricity for 2015 increased by PLN 8 on the price of corresponding contracts for 2014.
Coal
In 2014, coal production increased by 0.3%, withheld mostly by oversupply, low coal prices, lower exports to China, lower oil prices in H2 2014 and the overall macroeconomic conditions. Coal production in 2015-2016 is forecast to grow at an annual rate of ca. 0.9%.
According to the Economist Intelligence Unit, in 2014 the rise in coal consumption at merely 1% was the weakest in ten years.